React+express+sqlite3
- Suneetha Yamani
- Jun 29, 2020
- 1 min read

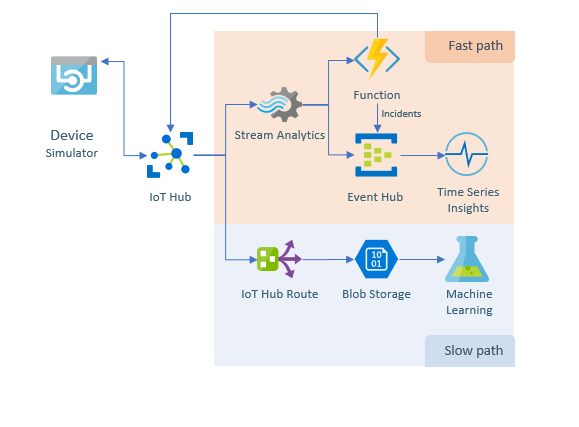
To create a iot dashboard using react,d3, node and sqlite3
mkdir node-express
cd node-express
npm install express
npm install sqlite3
create database.js file to connect to data base

create server.js to fetch records from db

add start script in package.json "start": "node server.js"

now run your application using npm start
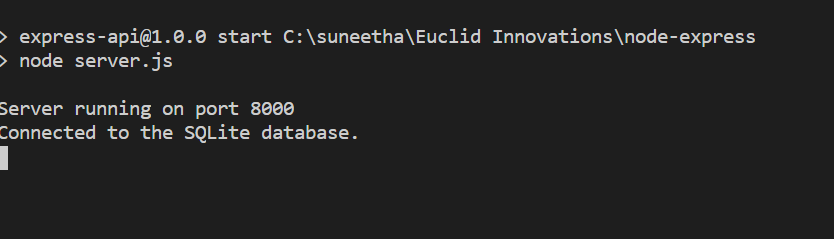
test your api accessing http://localhost:8000/api/sensor

Create React APP
npx create-react-app my-app cd my-app npm start
access your application using http://localhost:3000/

To call you backend api install axios
npm install axios
To create line chart using d3 js
npm install d3
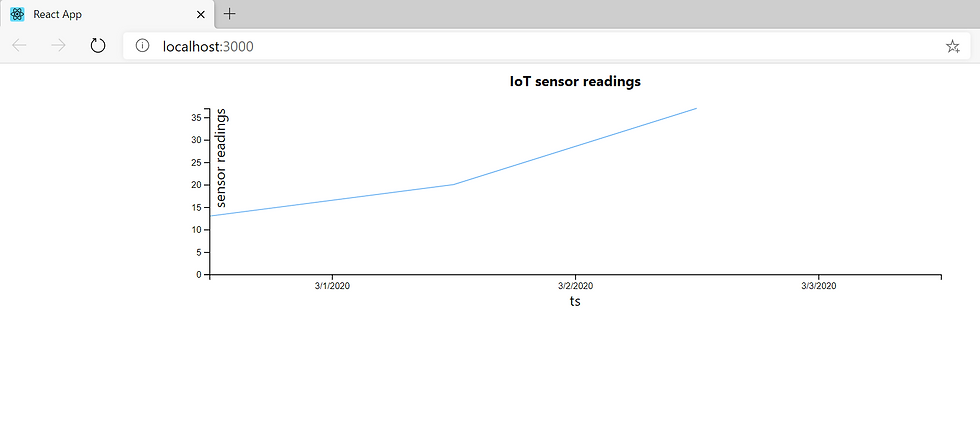
To create Line chart create a component and access your node api to fetch data using axios

createLineChart () { const node = this.node var margin = { top: 50, right: 35, bottom: 65, left: 50 } var width = 900 - margin.left - margin.right var height = 300 - margin.top - margin.bottom var x = d3.scaleBand().rangeRound([0, width]) var y = d3.scaleLinear().rangeRound([height, 0]) var svg = d3 .select(node) .append('svg') .attr('width', width + margin.left + margin.right) .attr('height', height + margin.top + margin.bottom) .append('g') .attr( 'transform', 'translate(' + margin.left + ',' + margin.top + ')' ) axios.get('http://localhost:8000/api/sensor').then(response => { // Scale the range of the data x.domain( response.data.data.map(function (d) { return d.timestamp }) ) y.domain([ 0, d3.max(response.data.data, function (d) { return +d.sensor_reading }) ]) // define the line var valueline = d3 .line() .x(function (d) { return x(d.timestamp) }) .y(function (d) { return y(d.sensor_reading) }) svg .selectAll('.line') .data([response.data.data]) .enter() .append('path') .attr('class', 'line') .attr('d', valueline) .style('stroke', '#6ab7ff') .style('fill', 'none') // Add the X Axis svg .append('g') .attr('transform', 'translate(0,' + height + ')') .call(d3.axisBottom(x)) // Add the Y Axis svg .append('g') .call(d3.axisLeft(y)) // y axis label svg .append('text') .attr('transform', 'rotate(-90)') .attr('y', 6) .attr('dy', '.71em') .style('text-anchor', 'end') .text('sensor readings') // text label for the x axis svg.append('text') .attr('transform', 'translate(' + (width / 2) + ' ,' + (height + margin.top - 15) + ')') .style('text-anchor', 'middle') .text('ts') // title svg.append('text') .attr('transform', 'translate(' + (width / 2) + ' ,' + (0 - (margin.top / 2)) + ')') .style('text-anchor', 'middle') .style('font-weight', 'bold') .text('IoT sensor readings') }) }
add line chart component in APP.js
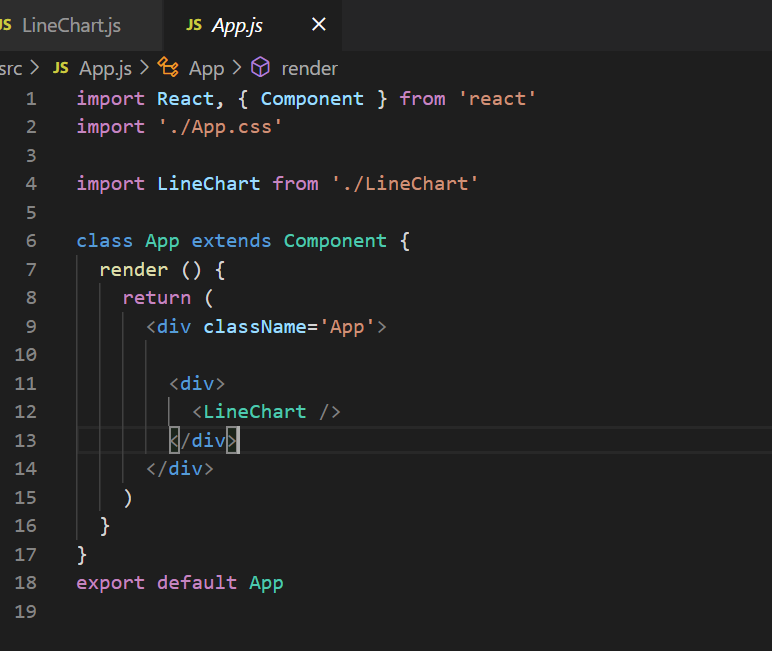
run npm start

Comments